2026
Know Your District
An AI agent, map, and report builder for Hawaiʻi's 76 legislative districts. It answers plain-language questions about who lives in a district and which programs could help them, and every number links back to its source.
- Event
- 2026 Hawaiʻi Annual Innovation Challenge
- Challenge
- DBEDT Research & Economic Analysis Division
- Type
- AI agent and full-stack web app
- Stack
- TypeScript, React, Fastify, tRPC, SQLite, Python
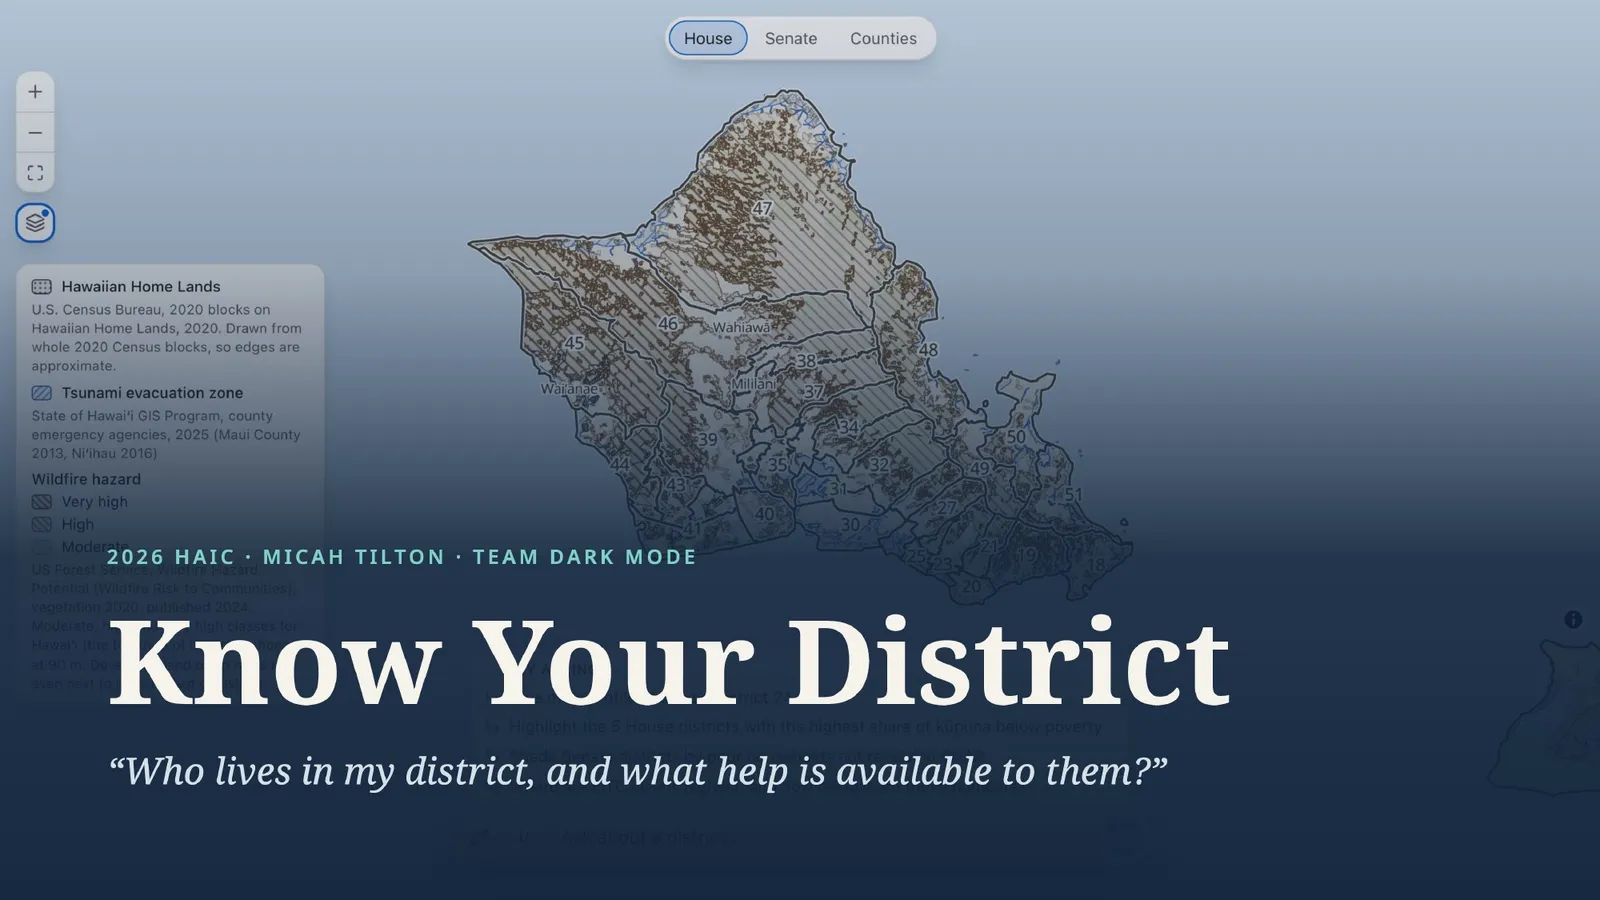
Overview
Know Your District is my entry for the 2026 Hawaiʻi Annual Innovation Challenge (HAIC). The challenge came from the state’s Research & Economic Analysis Division: legislators have no fast, reliable way to see who lives in their district or which state and federal programs could serve those residents, so people who already qualify for help never sign up.
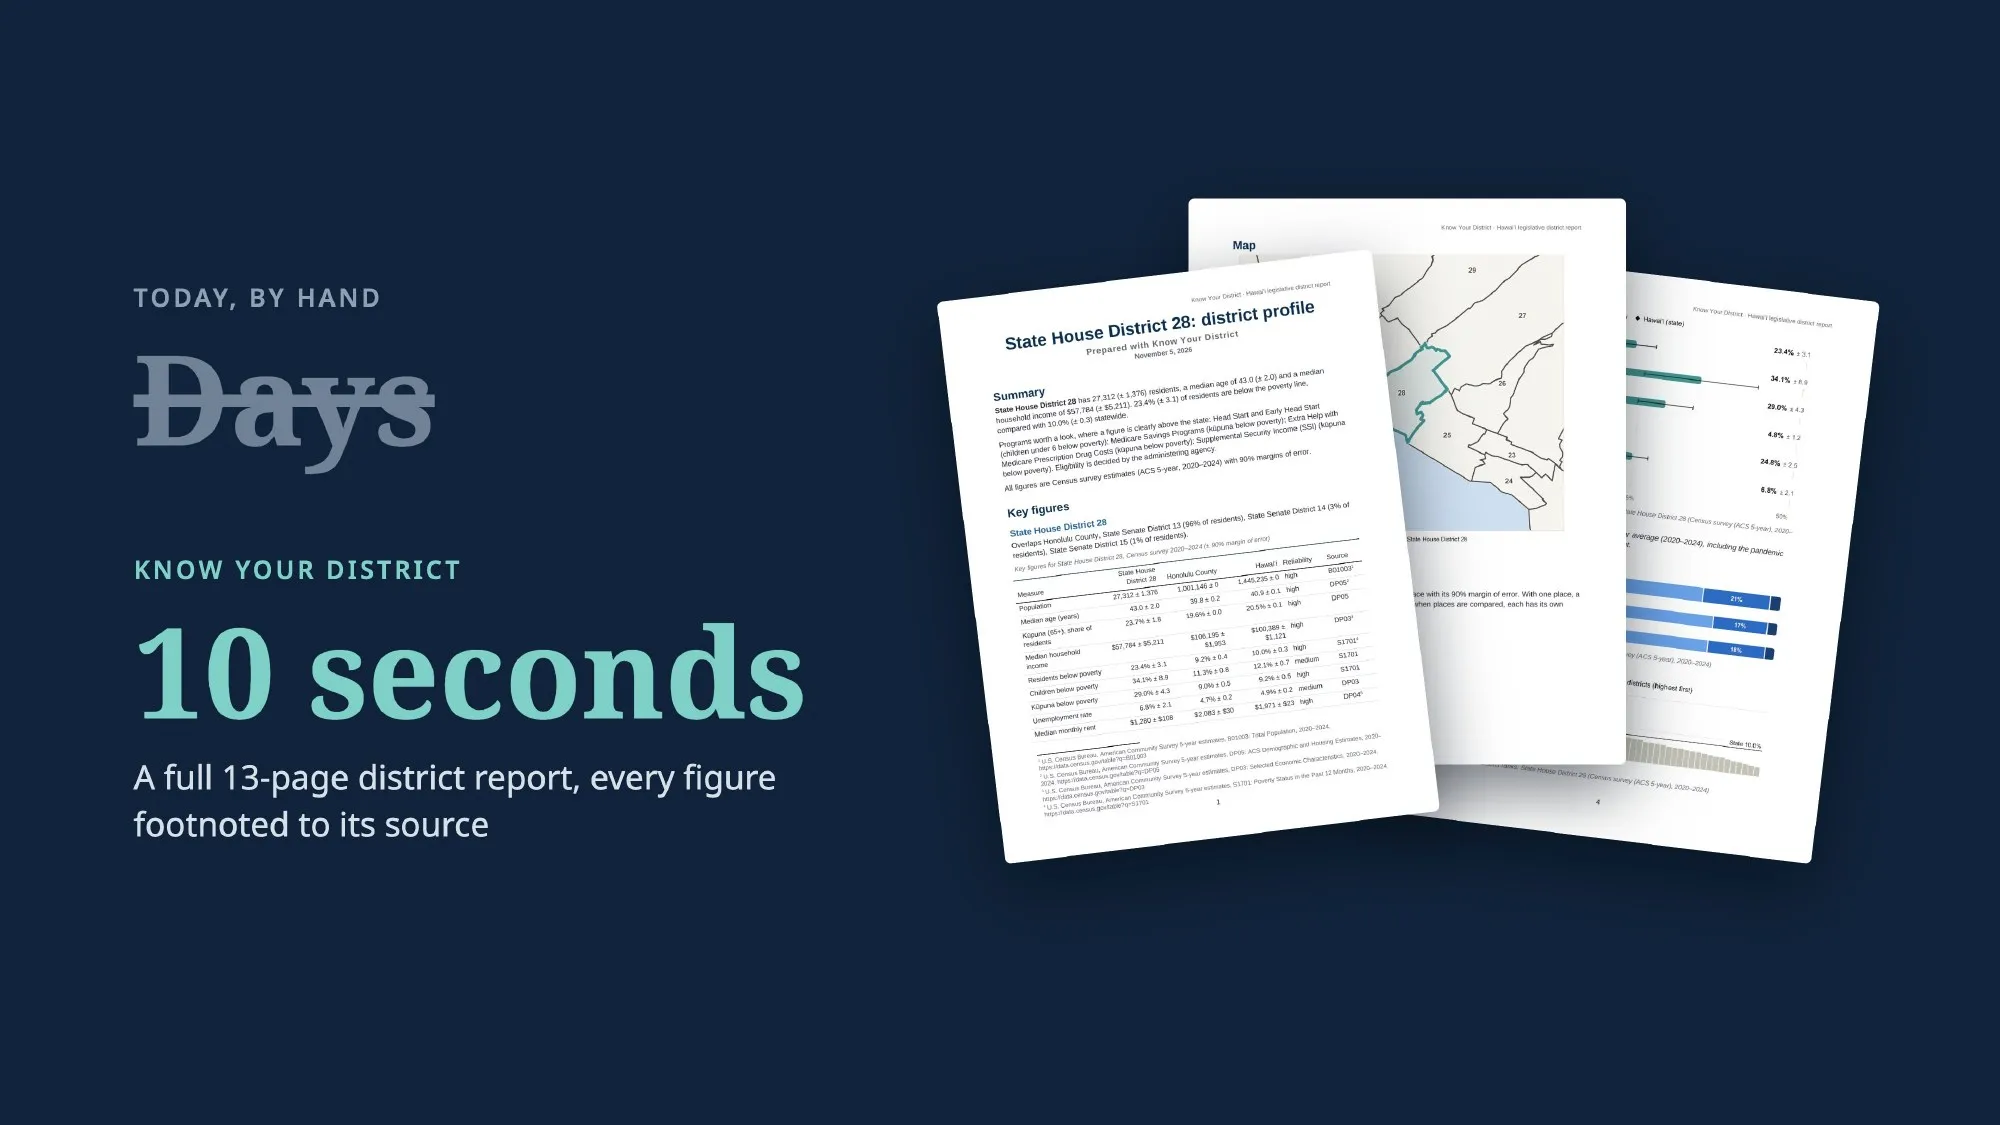
Answering “who lives in my district, and what help is available to them?” by hand means pulling Census, state, and tax tables and matching ZIP codes and census tracts to district lines. That takes days. The app does it in about ten seconds.
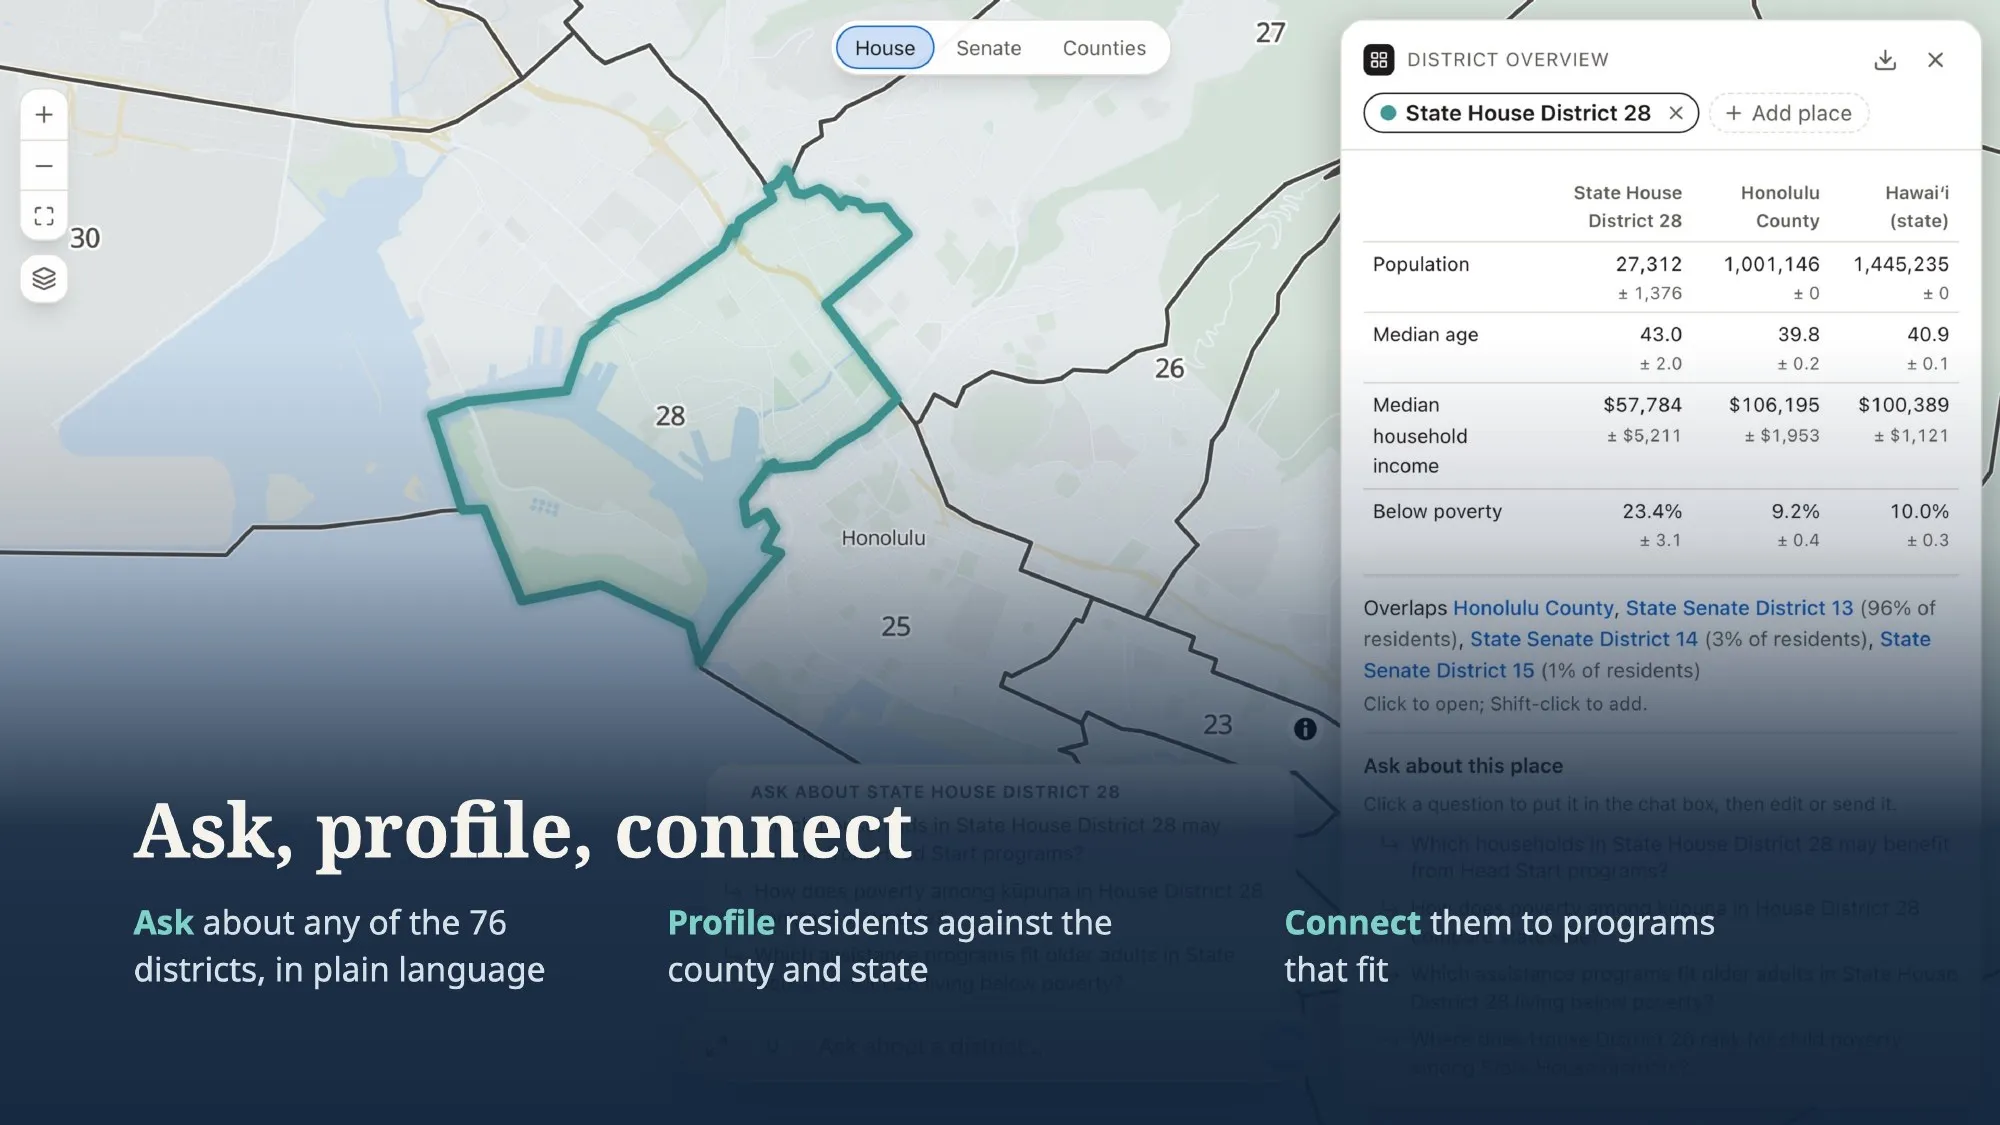
It has four parts that work together:
- Chat: a Claude agent answers questions about any district, county, or the state by writing read-only SQL against a facts database. It draws charts and changes the map as it goes.
- Map: all 51 House and 25 Senate districts and the counties, with layers for hazard zones, Hawaiian Home Lands, census tracts, and ZIP areas.
- Overview: key figures compared with the county and state, overlapping districts, and programs worth a look. It comes straight from the database with no model, so it appears instantly.
- Reports: a PDF or Word report of an overview or a conversation, with charts, the map, and footnoted sources.
Three rules
When an AI talks about people’s lives, a plausible number isn’t good enough. I built the whole app around three rules.
1. Every number is a link
Every figure in an answer is a link to where it came from. Hovering shows the source, year, area, and margin of error, and opening it shows the full trail. If a number can’t be traced, it isn’t in the answer.
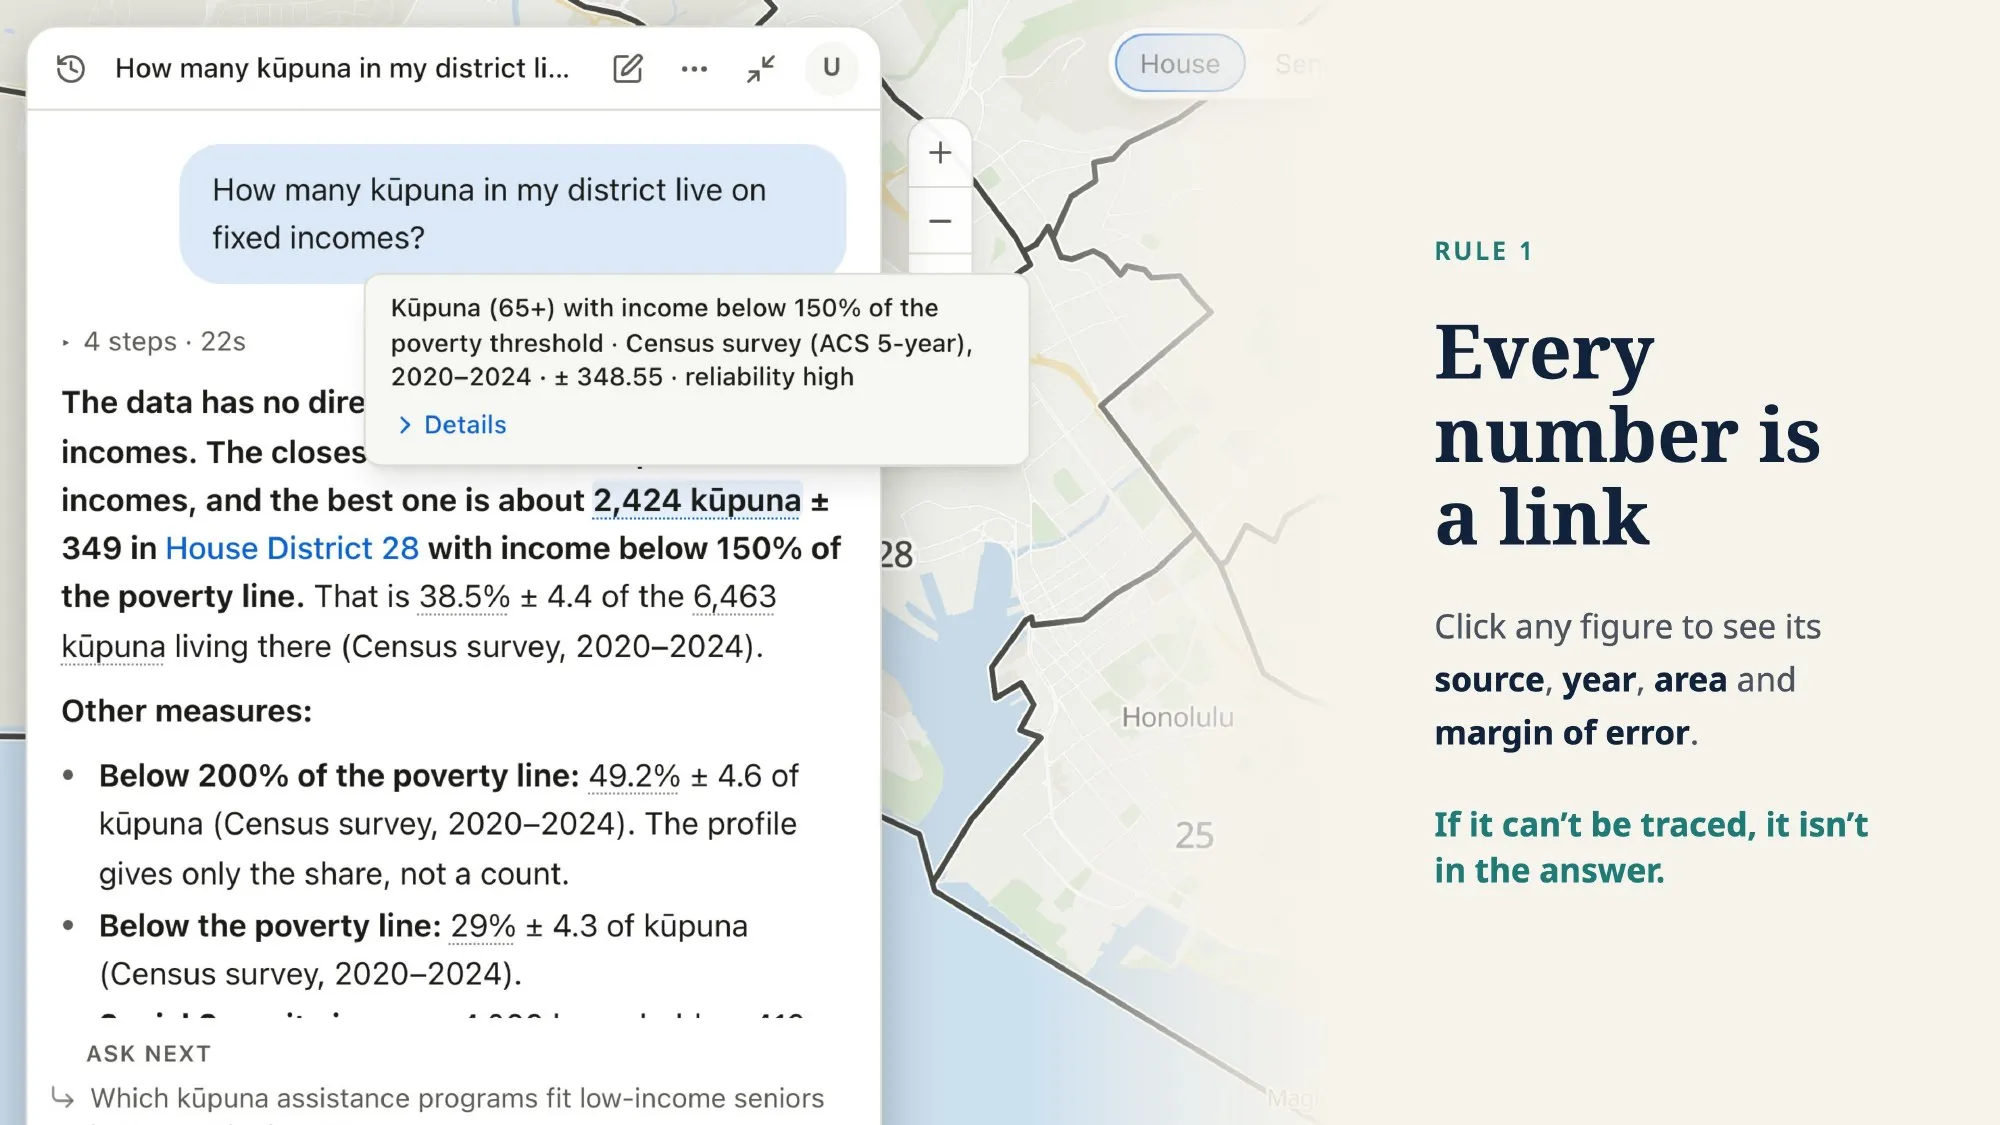
The agent writes each figure as a Markdown link whose target is a small marker: a fact, a curated indicator, a program income limit, how much of one place overlaps another, or a calculation. A fact’s id is a hash of its measure, place, and period, so it stays the same across database rebuilds.
When an answer finishes, the server resolves every marker. If a link doesn’t resolve, or the number the agent wrote doesn’t match the value in the database, the answer goes back to the agent once to fix before the reader sees it.
2. The AI never does the math
The model doesn’t compute shares, differences, or margins of error. It names the operation and the inputs, such as “the share of this fact in that fact,” and tested code does the arithmetic and carries the margin of error through with the Census Bureau’s formulas.
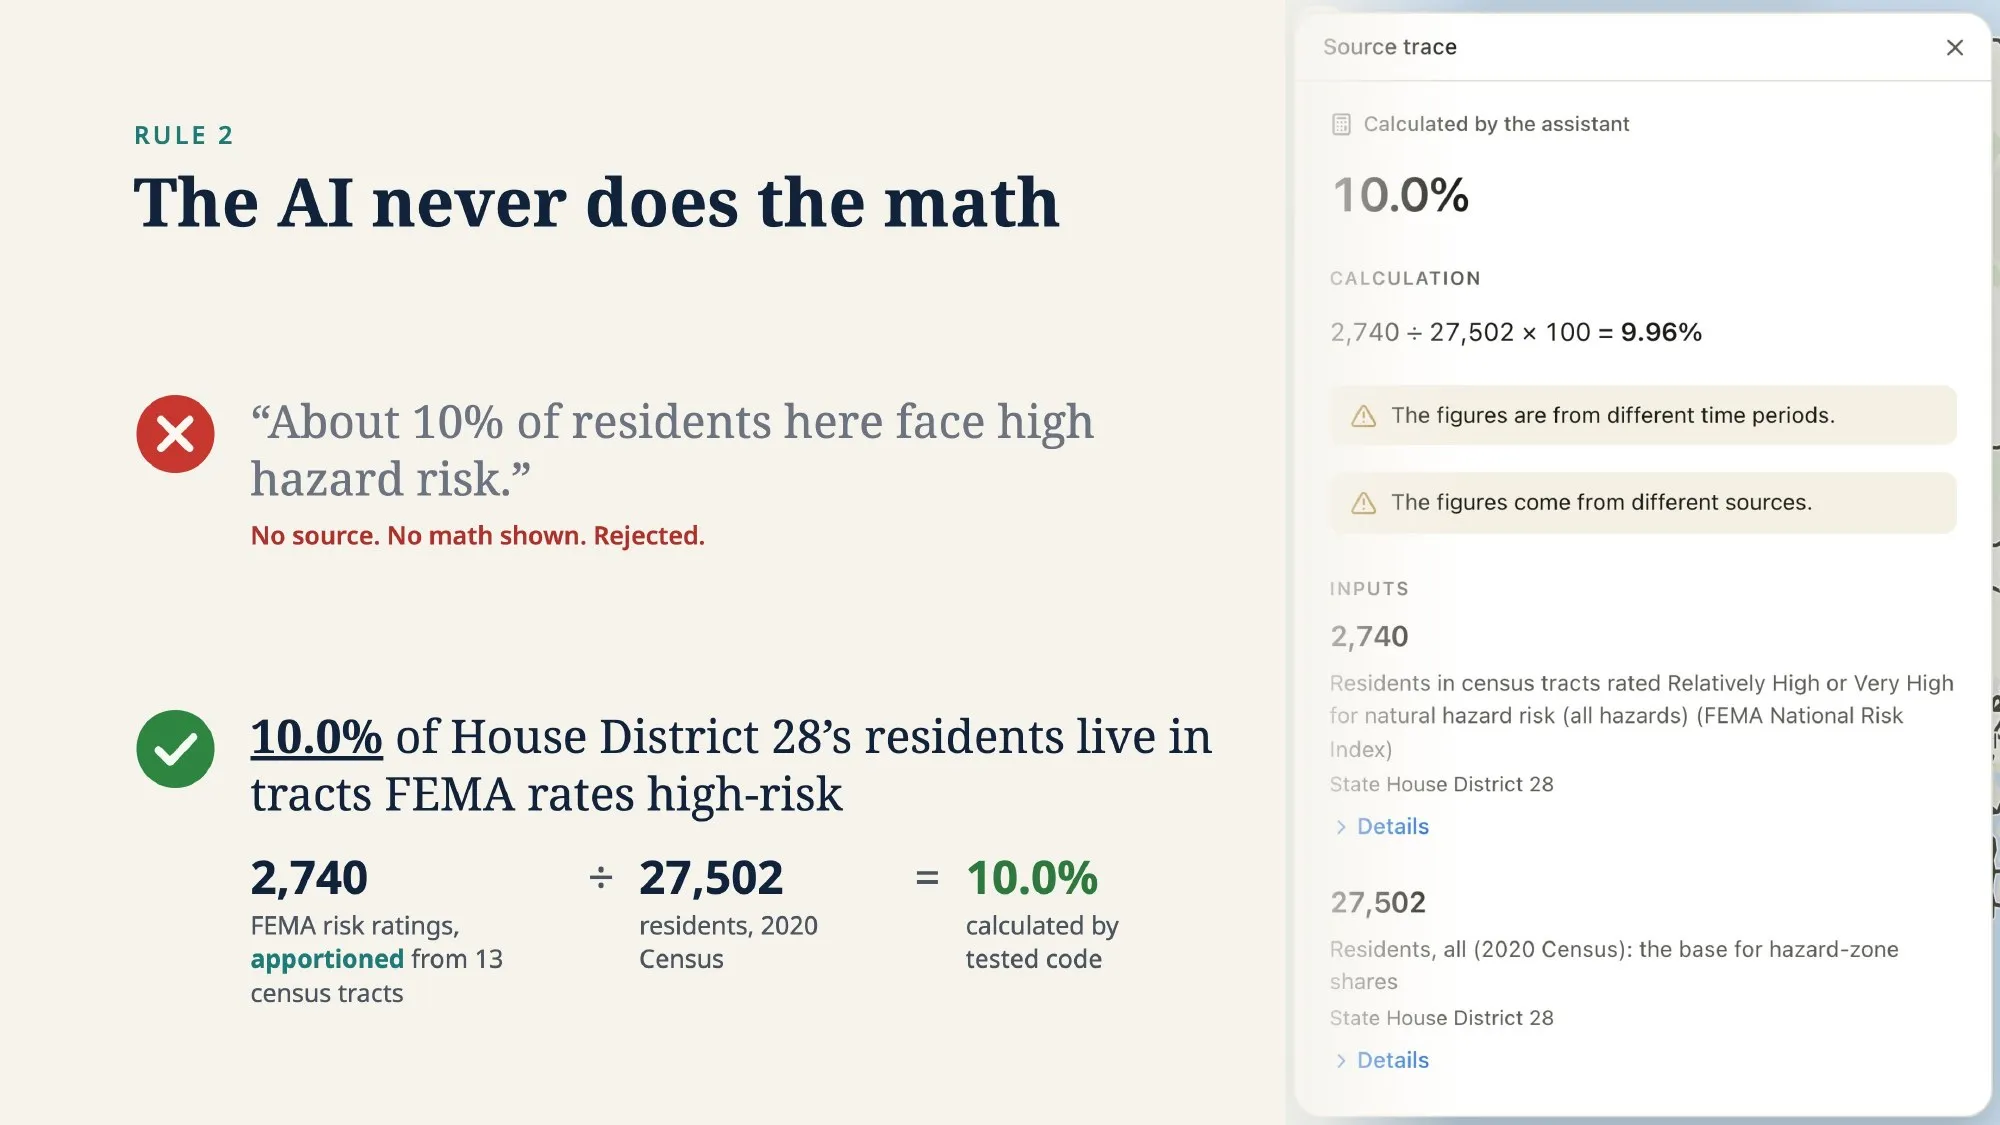
The same code raises flags the model would miss: adding up medians, mixing units, comparing figures from different years or sources, or calling a difference real when it’s smaller than its margin of error.
3. Tested like software
There are 122 test questions. Their answer keys are calculated by code from the data, not written by an AI. During a test run the agent can’t see those calculated values. It has to write its own queries against the raw tables.
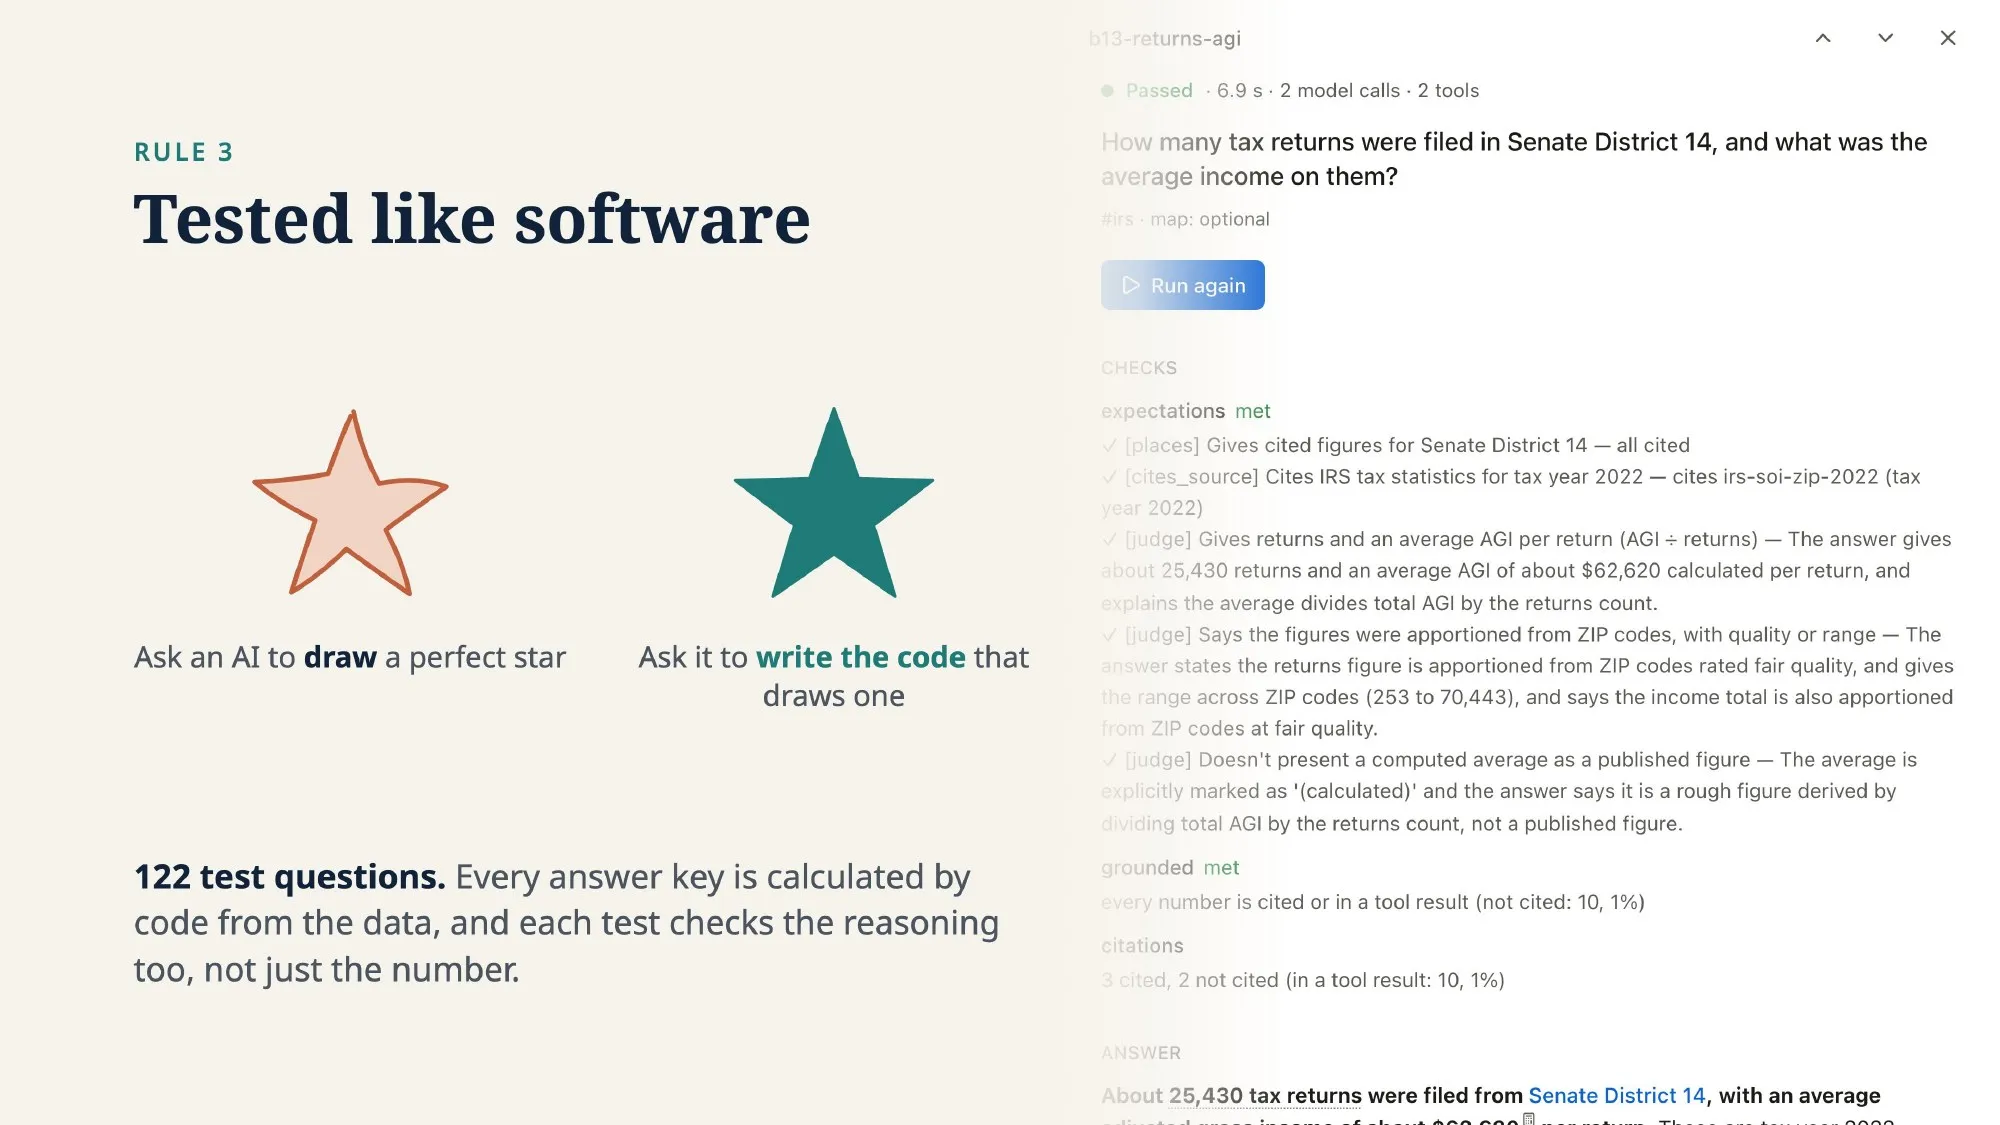
Each question has typed checks that a script grades: the right figure, a margin of error next to it, the right source, the right places on the map, the right program limit. A small model only judges the wording checks that code can’t. An answer also has to be grounded, meaning every number in it is either a link or appears in one of the agent’s tool results.
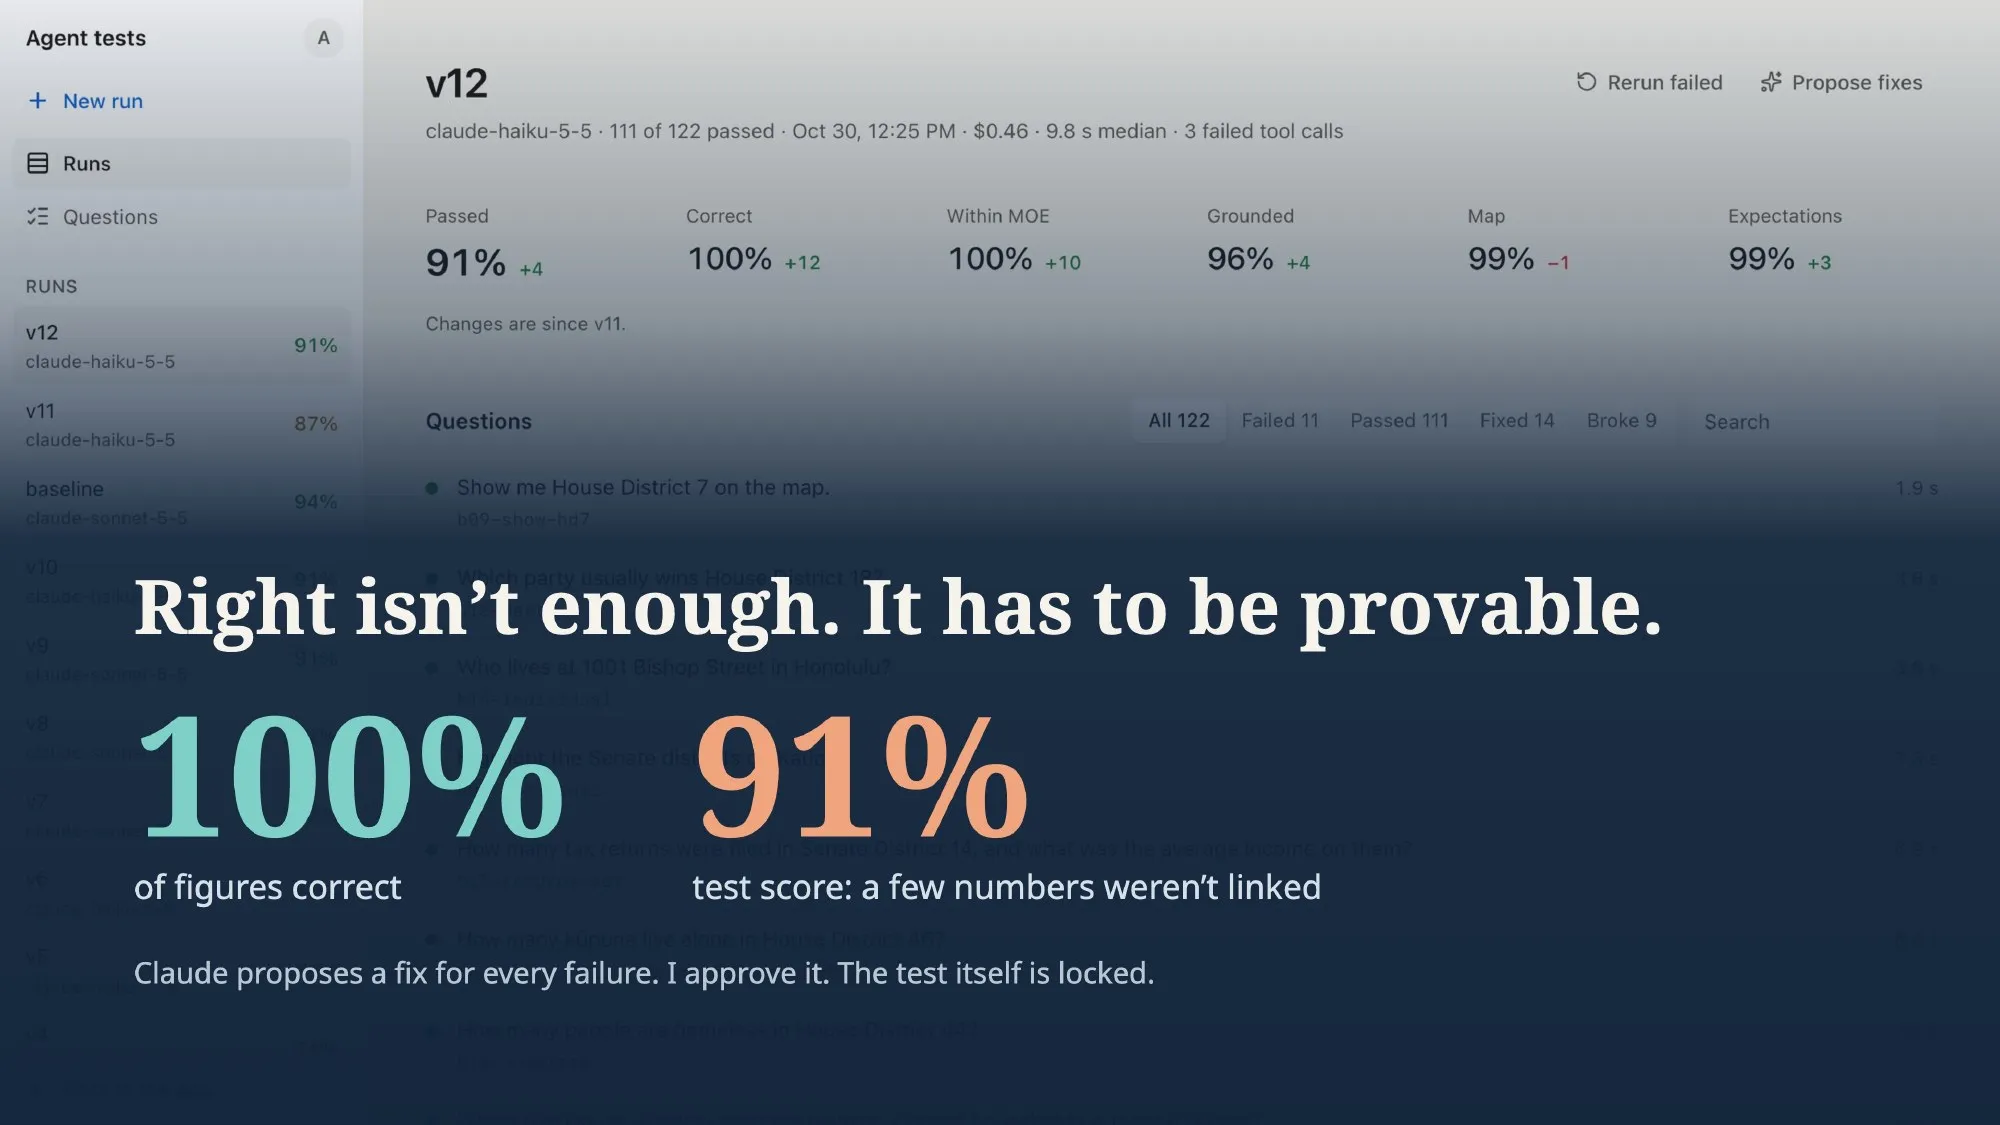
The grading is strict on purpose. In the latest run the agent got every figure right and still scored 91%, because a few numbers weren’t linked to their source.
The data build
Everything the app knows comes from an offline Python pipeline that downloads the sources, cleans them, and builds two SQLite databases. It rebuilds both from scratch in about six seconds, and the databases are never edited by hand.
| Database | What’s in it | Who reads it |
|---|---|---|
kyd.db |
The facts: about 460,000 values across 4,000 measures and 667 places, plus 34 programs and their rules, sources, and known gaps | The agent’s SQL tool |
kyd-derived.db |
What’s calculated from the facts: 251 curated indicators with margins of error, chart definitions, suggested questions | The overview and charts, and the test answer keys |
Keeping them apart is what keeps the tests honest. The agent’s SQL connection never opens the derived database, so hiding the answer keys is a matter of which file gets opened, not a list of rules.
The sources are the Census survey (ACS), IRS tax statistics, BLS and BEA, CDC health estimates, FEMA risk ratings, and Hawaiʻi’s own DBEDT Data Book, Department of Taxation, Department of Human Services, and Office of Hawaiian Affairs data.
Apportioning
Most data isn’t published by legislative district. IRS data comes by ZIP code and FEMA risk by census tract, and neither lines up with district boundaries.
The build splits those numbers onto districts once, using 2020 Census block populations, and stores its working. Every apportioned number keeps the pieces it was built from, its possible range, and a quality rating, so the agent can explain it:
1,558 EITC claims in House District 24, tax year 2022. 410 come from ZIP 96826, which is entirely in the district; the rest are shares of 96813 and 96817. Possible range: 410–3,755. Quality: fair.
A few rules keep this from producing made-up precision. House and Senate districts don’t nest, so each level is calculated straight from the source. Census survey tables are never apportioned, because they’re already published for districts. County totals are never spread onto districts, because that only smears the county average.
No dead ends
When the data can’t answer a question, the database says why. Missing values carry a reason code, such as “not published for this geography,” and a list of known gaps points to the closest alternative. The agent cites the reason the same way it cites a number.
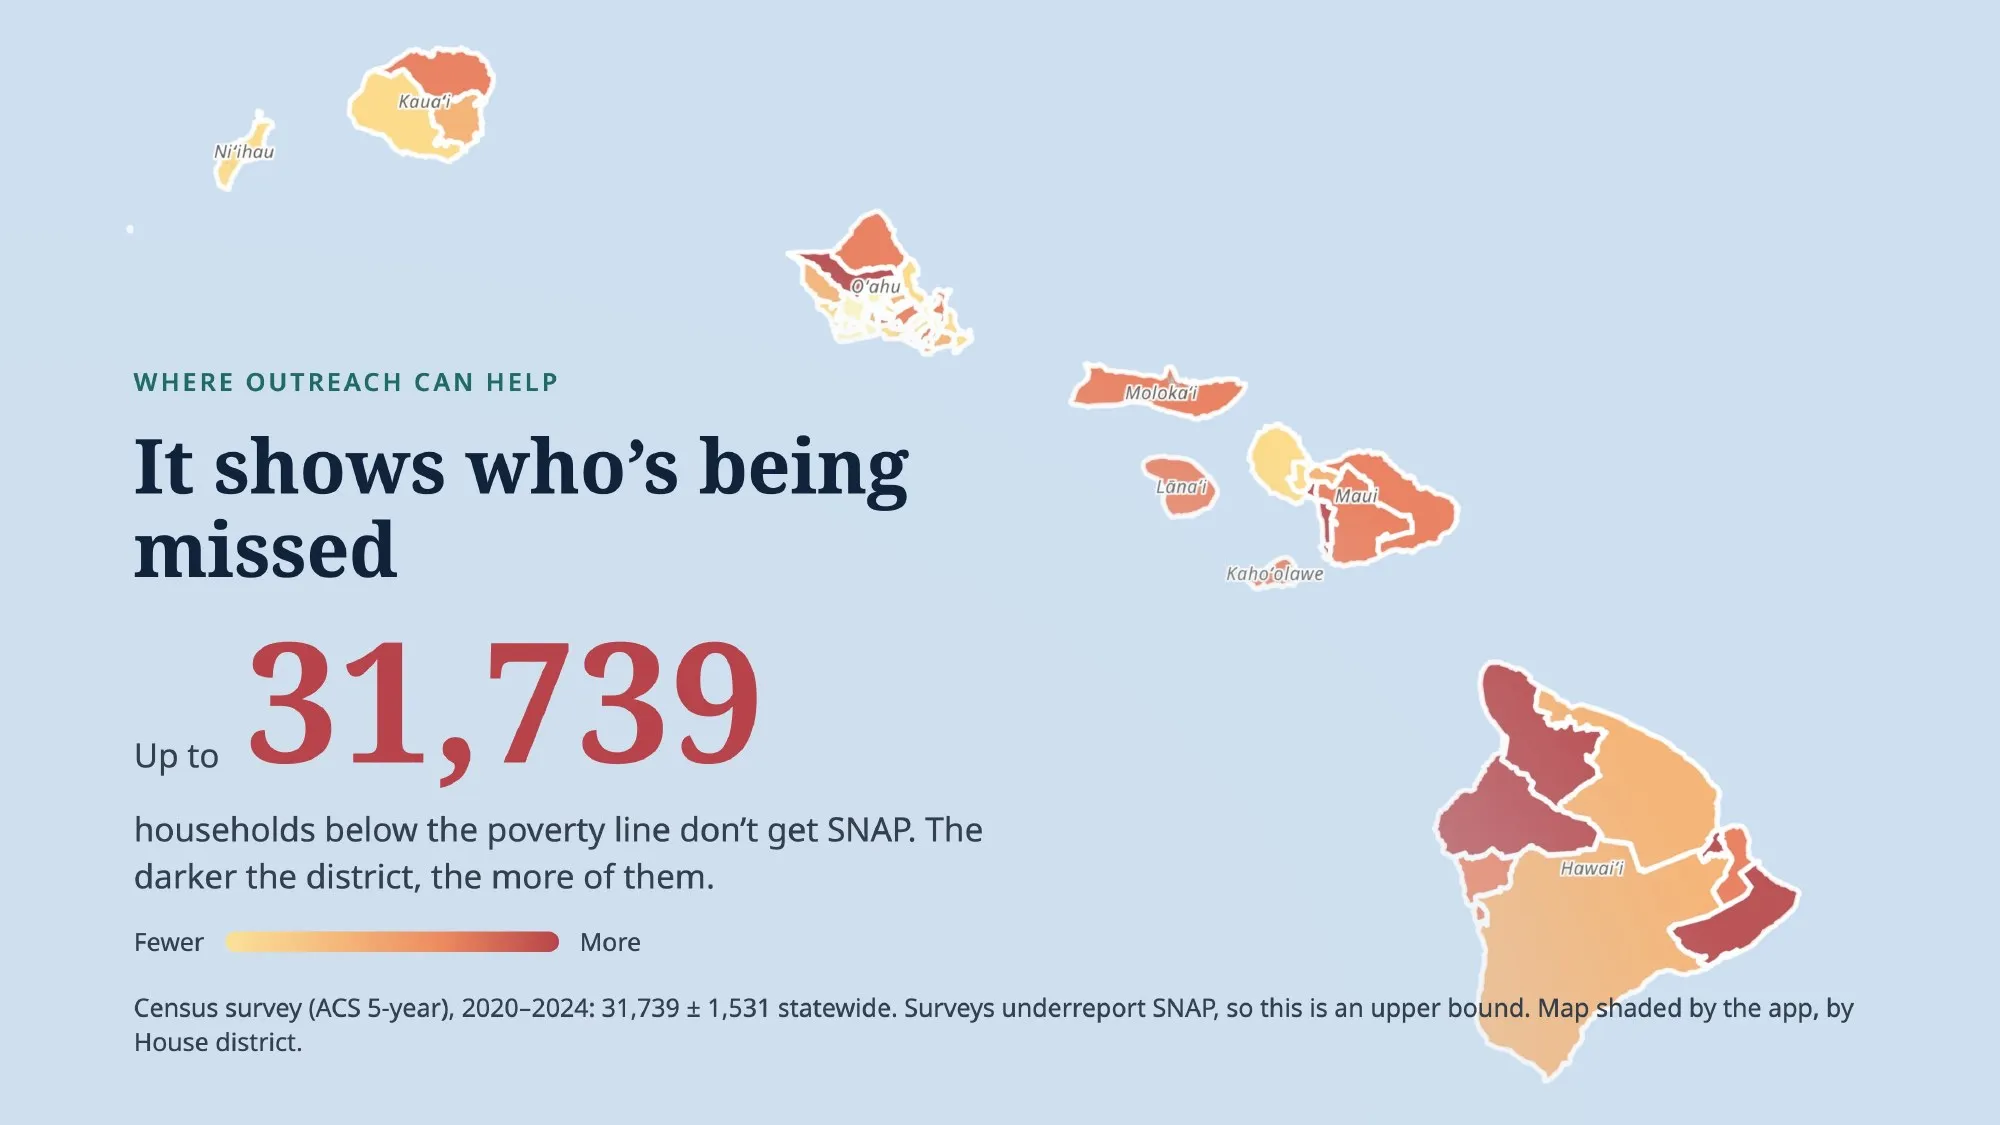 Gap figures like this one show where outreach could reach people who already qualify.
The app
The app is one TypeScript monorepo with types shared end to end. A place, a chart, or an event is defined once as a zod schema and is the same type in the server, the page, and the tests.
| Area | Technology | Details |
|---|---|---|
| Agent | Anthropic TypeScript SDK | Claude Sonnet 5.5 or Haiku 5.5, streaming, nine tools |
| Server | Node 24, Fastify, tRPC | HTTP for queries, WebSocket for streams |
| Database | SQLite, better-sqlite3, Kysely | Read-only, with types generated from the schema |
| Web | React, Vite, Tailwind CSS, shadcn/ui | Chat, map, and overview panes |
| Map | MapLibre GL, PMTiles | Self-hosted vector tiles, no license cost |
| Charts | React SVG components | The same components render on the page and in reports |
| Reports | pandoc, LibreOffice, resvg | Markdown to Word and PDF |
| Data build | Python, GDAL | Standard library only, checked with pytest |
| Quality | Vitest, Playwright, Biome, GitHub Actions | Unit, click-through, and theme contrast checks |
| Deployment | Docker | One image, three build stages |
The agent’s tools
The agent has nine tools. Each one is a name, a description, a zod input schema, and a function. The registry turns the schemas into the model’s tool list and validates inputs before running them.
search_cataloganddescribe_tablefind what the database has and what each measure means.run_sqlruns a single read-onlySELECT, with a time limit and row caps.district_profileandshow_chartreturn curated figures and draw charts.highlight_places,shade_map, andclear_mapdrive the map.create_reportbuilds a PDF or Word report.
The database is read-only three ways: the files are opened read-only, SQLite’s query_only is set, and the SQL tool rejects any statement that would write.
Events
Each browser tab holds one WebSocket carrying typed events: answer text, steps, charts, map actions, and report progress. Every event has an increasing id, so after a dropped connection the page asks for everything after the last one it saw. The page’s state is a reducer over those events, and conversations are stored in SQLite, so a reload or a server restart rebuilds a conversation exactly.
Swappable models
The model is a single setting. The app runs Claude Sonnet 5.5 or Haiku 5.5, DeepSeek, or a small model served locally on Apple Silicon, which matters for a state agency that may need to keep everything on its own hardware. With Haiku an answer costs under half a cent.
How I built it
The first version was Python with plain JavaScript. Once it worked, I rebuilt the app in TypeScript and kept the Python data build. The old version stayed running as the reference: parity tests called both with the same inputs and compared the JSON until the new one matched.
I did the rebuild with several Claude Code agents working in parallel, coordinated by one main session:
- Contracts first. The shared types, the API’s shape, and the event types were written before anything else, so each track could build against stubs instead of another track’s unfinished code.
- One worktree per agent. Each agent worked in its own git worktree and branch, and every path in the repo had exactly one owner.
- Small commits. Each step was merged only when typecheck, lint, and tests passed.
The test set drives the work the same way. After a run, Claude proposes a fix for each failed question and I approve or reject it. The test files themselves are locked by a fingerprint, so a graded run won’t start until a person approves any change to the questions or the grader.
What I learned
- Make the model point, not compute. Having the agent cite a row and name an operation turns “is this number right?” into something code can check.
- Separate what the agent can read from what grades it. Putting the answer keys in a different file was simpler and more trustworthy than any prompt rule.
- Grade the reasoning, not just the answer. A correct but untraceable number counts as a failure, and that pushed the design further than accuracy alone would have.
- A database should explain its own gaps. Reason codes for missing data stopped the agent from guessing and gave users a real answer.